Welcome to Spatial Scholar Academy

Where GIS, Remote Sensing and Research Finally Make Sense

Geospatial services for businesses, institutions and researchers

Clear maps. Practical analysis. Purposeful modelling.

Turn location data and satellite imagery into useful outputs. We create maps, analyse spatial patterns and develop documented methods, with practical training to help you use them.

South Africa Spatial Intelligence Explore provinces, coordinates and practical applications
LOADING
Preparing geographic layers Loading the local province boundaries and example locations
Map coordinates Move across or click the map
Selected feature South Africa
Learning layers Drought Flood Agriculture Conservation Academy hub

Simplified 2020 boundaries for geographic context. Example locations illustrate methods; they are not live monitoring feeds.

Preparing nine provincial boundaries... Click the map for decimal degrees

Remote sensing in action

South Africa from Space

Explore how satellite imagery and spatial analysis can answer practical questions about water, land and agriculture.

Illustrative applications of our methods. These are not completed client projects or live assessments.

Cape Town Drought Monitoring

Compare water extent and vegetation conditions across dates to put a changing landscape into context.

Explore this example

How has the visible surface area of a reservoir changed?

Data to start with

Landsat or Sentinel-2 imagery from comparable seasons, reservoir boundaries, rainfall records and available dam-level measurements.

A practical method

  1. Choose suitable dates and remove cloud and shadow.
  2. Map open water consistently, then compare its extent.
  3. Review the result against rainfall and measured reservoir levels.

Useful outputs

A series of dated maps, an area-change table and a short explanation of data quality and interpretation.

Mapped water area alone does not measure stored water volume or establish the cause of a drought.

See NASA's Cape Town satellite example ↗
KZN Flood Mapping

Explore how satellite observations and location data can help identify possible inundation and exposed assets.

Explore this example

Where is possible inundation visible, and what lies nearby?

Data to start with

Suitable before-and-after satellite observations, terrain data, permanent-water layers and verified roads, buildings or project locations.

A practical method

  1. Prepare optical imagery or suitable radar observations for comparison.
  2. Identify potential inundation and check permanent water and terrain effects.
  3. Validate against independent observations before summarising asset exposure.

Useful outputs

A dated indicative extent map, an exposure summary and documented confidence limits.

Satellite extent mapping does not by itself establish flood depth, future flood risk or safe access. Timing and validation matter.

Read NASA ARSET's flood-mapping overview ↗

Free State Agriculture

Use vegetation indicators and field boundaries to see where conditions vary and where closer inspection may help.

Explore this example

Which parts of a field differ from their usual seasonal pattern?

Data to start with

Cloud-screened optical imagery, field boundaries, rainfall information and crop or field observations.

A practical method

  1. Calculate a vegetation index such as NDVI for suitable dates.
  2. Compare field summaries across comparable growth stages and seasons.
  3. Use field observations to investigate unusual patterns.

Useful outputs

Vegetation maps, field-level summaries and a record of areas worth investigating.

NDVI is a vegetation indicator. It does not directly measure crop yield or identify a particular pest, disease or nutrient deficiency.

Explore NASA's guide to vegetation indices ↗

Geospatial news and impact

How spatial technology is changing the world

Explore credible stories about GIS, Earth observation, satellite missions and the ways spatial intelligence supports communities, environments and decision-making.

Loading the latest academy news file...

Loading geospatial stories...

Academy editorial standard

Every card identifies the original organisation and links to its full publication. Spatial Scholar Academy provides a short educational summary, not a copied news article.

Expertise, education and community

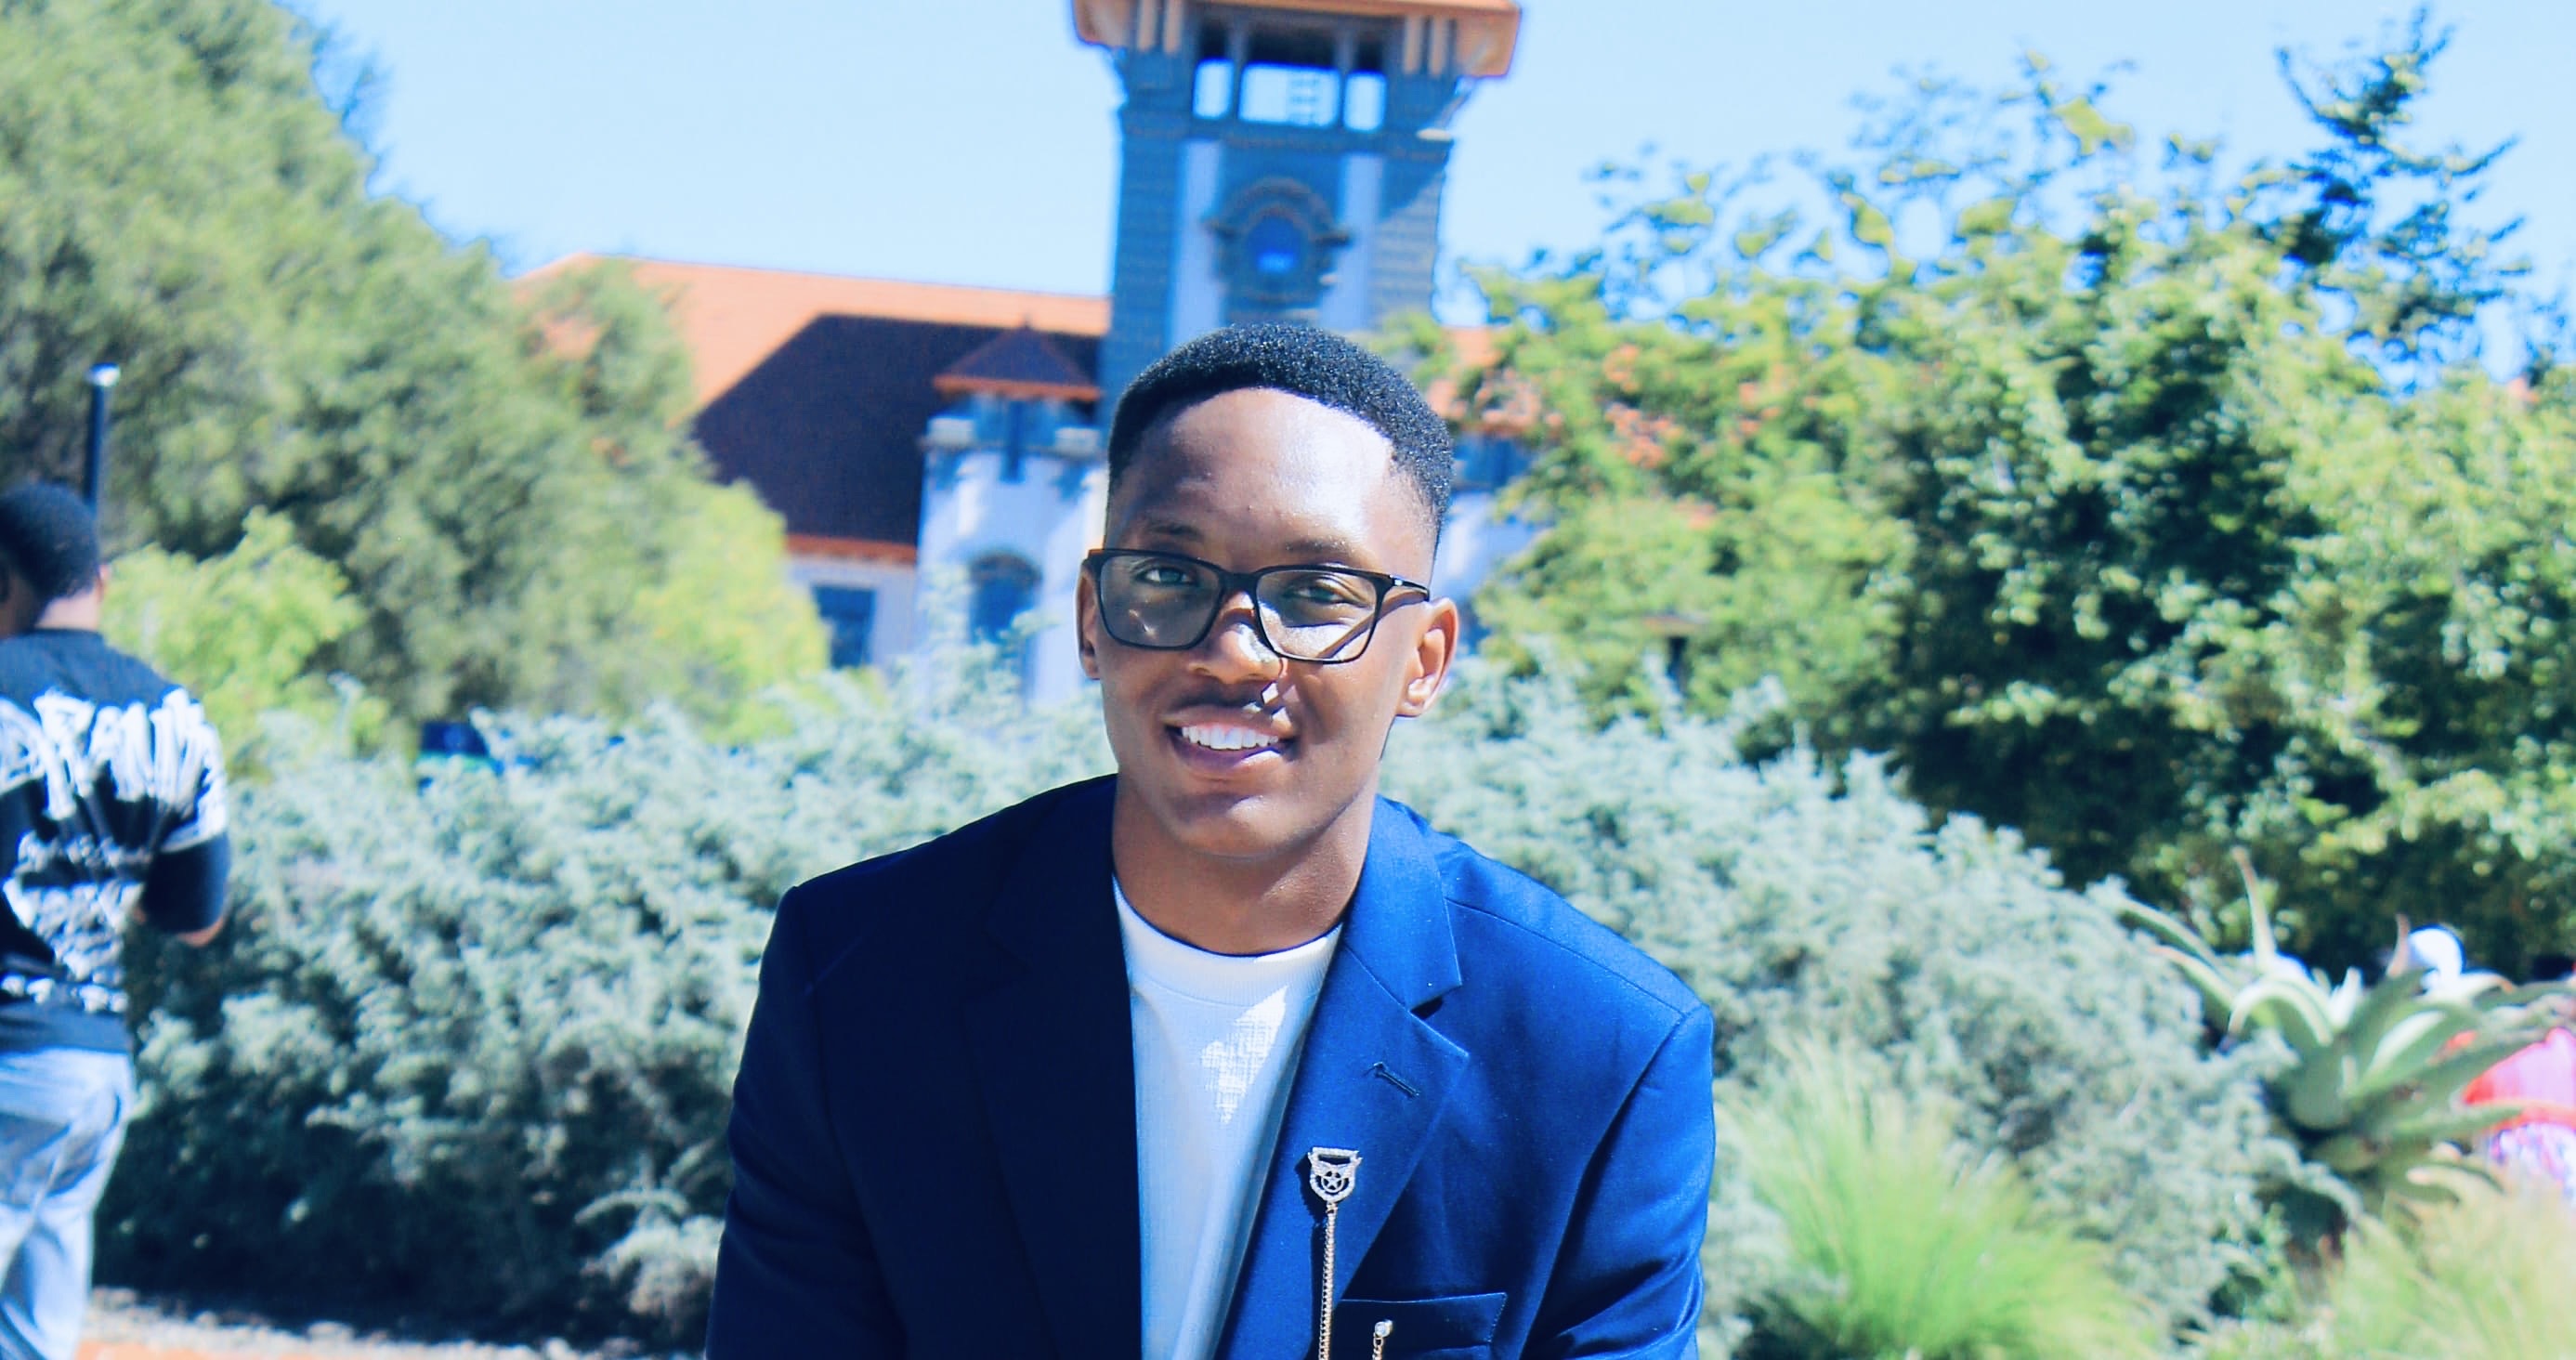
Meet the Director

Tlotlo Nkwe, founder and director of Spatial Scholar Academy
Tlotlo NkweFounder & Director · Bloemfontein, South Africa

The person behind your project

Tlotlo Nkwe

Geospatial researcher, lecturer and educational content developer.

PhD candidate · GeoinformaticsMSc · GeoinformaticsJunior Lecturer

Tlotlo holds an MSc in Geoinformatics and is a PhD candidate specialising in Geoinformatics at the University of the Free State, where he also works as a Junior Lecturer. His work brings together GIS, remote sensing and environmental spatial analysis.

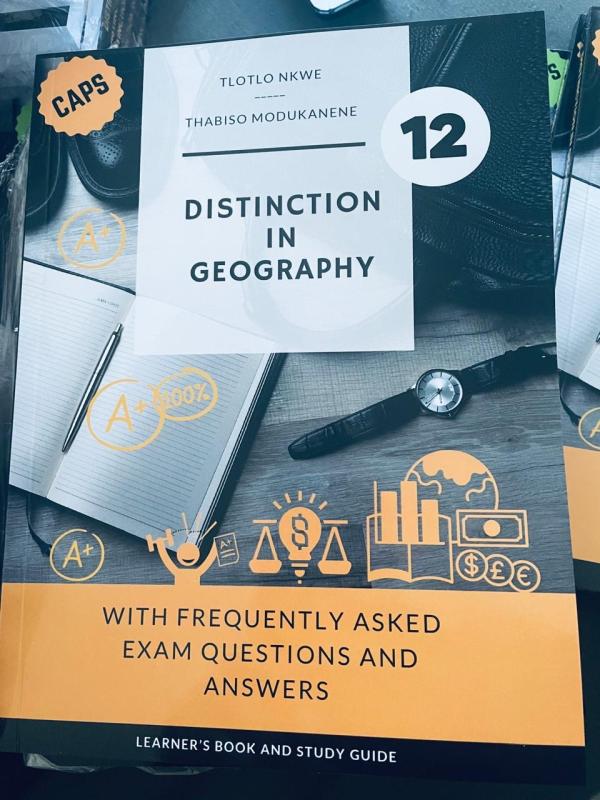
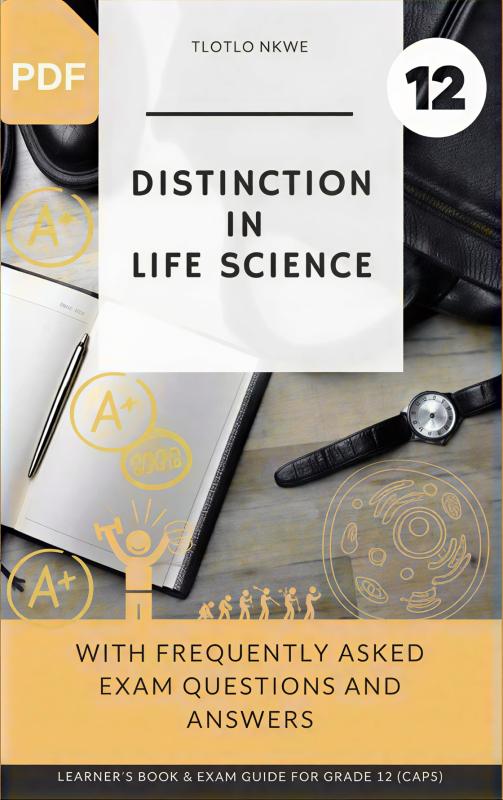
He develops curriculum-aligned educational content for secondary-school learners. He is the author of Distinction in Life Science and co-author of Distinction in Geography, two Grade 12 study guides that make complex ideas easier to understand and apply.

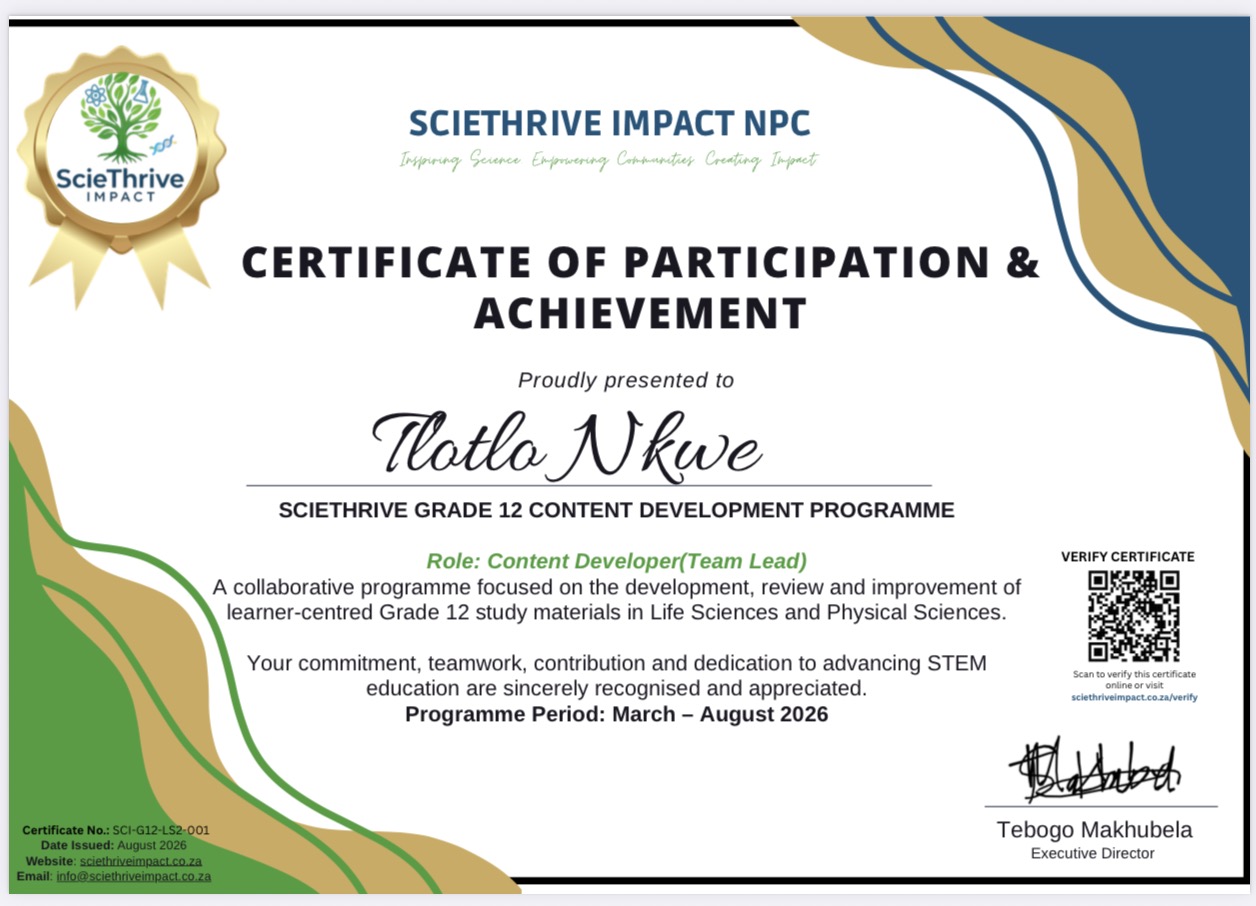
His community work includes serving as a volunteer Content Developer and Team Lead at ScieThrive Impact, and as Disciplinary Officer at CommUnity Fortress, a non-profit organisation.

A practical, transparent approach

Through Spatial Scholar Academy, Tlotlo focuses on useful maps, careful analysis and clearly explained methods. Each project starts with an agreed scope, suitable data and realistic deliverables.

Further qualifications and professional background

BSc Honours in Environmental Science (cum laude); BSc in Geography and Environmental Science.

SACNASP: Candidate Natural Scientist, Environmental Science. Registration number: 172015.

From a question to a useful output

Have a mapping or analysis project in mind?

Tell us about your area, available data and the output you need. We will discuss a suitable method, the scope and what can realistically be delivered.


Illustrative application

Selected work & recognition

Open original image at full size ↗